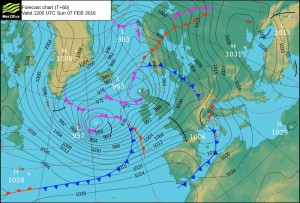
The isobars of a weather map are lines that connect areas of equal atmospheric pressure. The pressure is usually noted on every other isobar so you can see the pattern of pressure distribution. The point with the highest pressure is called a High. It is usually marked with a capital letter “H”. This high pressure center is surrounded by concentric circles of isobars, the isobars closest to the center of the High will have a higher number, than the ones further out. The area with the lowest pressure on the map is called a “low”, this is designated by a capital “L”.
The atmospheric pressure will attempt to reach an equilibrium, so air will flow from a high pressure area toward a low pressure area. The horizontal flow of air is called wind. The wind blows from High to Low, but not directly. Because of the earth’s rotation (Corriolis force) the wind will blow more parallel to the isobars. The wind blows clockwise around a High in the northern hemisphere. The Wind blows counterclockwise around a Low in the northern hemisphere. In the southern hemisphere the wind rotational direction is reversed. A lot of lines close together means strong winds. Areas with widely spaced isobars will have little or no wind.
On a weather map, you will notice some lines that have semi-circles or triangles on either side, or both. These indicate the boundaries for various types of fronts:
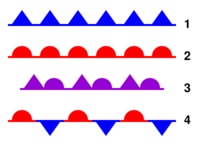 1. Cold front: Rainfall can be torrential and wind speeds can be high. Represented on a weather map as a (blue) line with triangles bordering one side. The direction that the triangles point is the direction in which the cold front is moving.
2. Warm front: Often brings a gradual increase in rainfall as the front approaches, followed by prompt clearing and warming after the front passes. If the warm air mass is unstable, the weather might be characterized by prolonged thunderstorms. Represented on a weather map by (red) lines with semi-circles on one side. The side that the semi-circles are on represent the direction in which the warm front is heading.
3. Occluded front: Formed when a cold front overtakes a warm front. Associated with a variety of weather events (possibly thunderstorms) depending on whether it is a warm or cold occlusion. The passing of an occluded front usually brings drier air (lowered dew point). Represented on a weather map by a line with semi-circles and triangles both on the same side. Whichever side they’re on is the direction the occluded front is going in.
4. Stationary front: Indicates a non-moving boundary between two different air masses. Long continuous rainy periods that linger for extended periods of time in one area and move in waves. Represented on a weather map by a line with semi-circles bordering one side and triangles along the opposite side, indicating that the front is not moving in any direction.
These mark the boundary between warmer air on one side and colder air on the other. If you are close to a front and you know the front is moving towards you, you can expect a change in weather (e.g. cloud formation, precipitation, thunderstorms, and wind) when the front boundary passes over you. Their path can be distorted by mountains and large bodies of water.
Links:
- Global Forecast System – NCEP/NOAA.
GFS - European Centre for Medium-Range Weather Forecasts.
ECMWF - Navy Operational Global Atmospheric Prediction System.
NOGAPS - The Meteorological Office.
Met Office - Weather Online.
Expert Charts